Charts and fraud events
Charts
The dashboard answers how your integration is behaving overall, rather than what happened in one attempt.
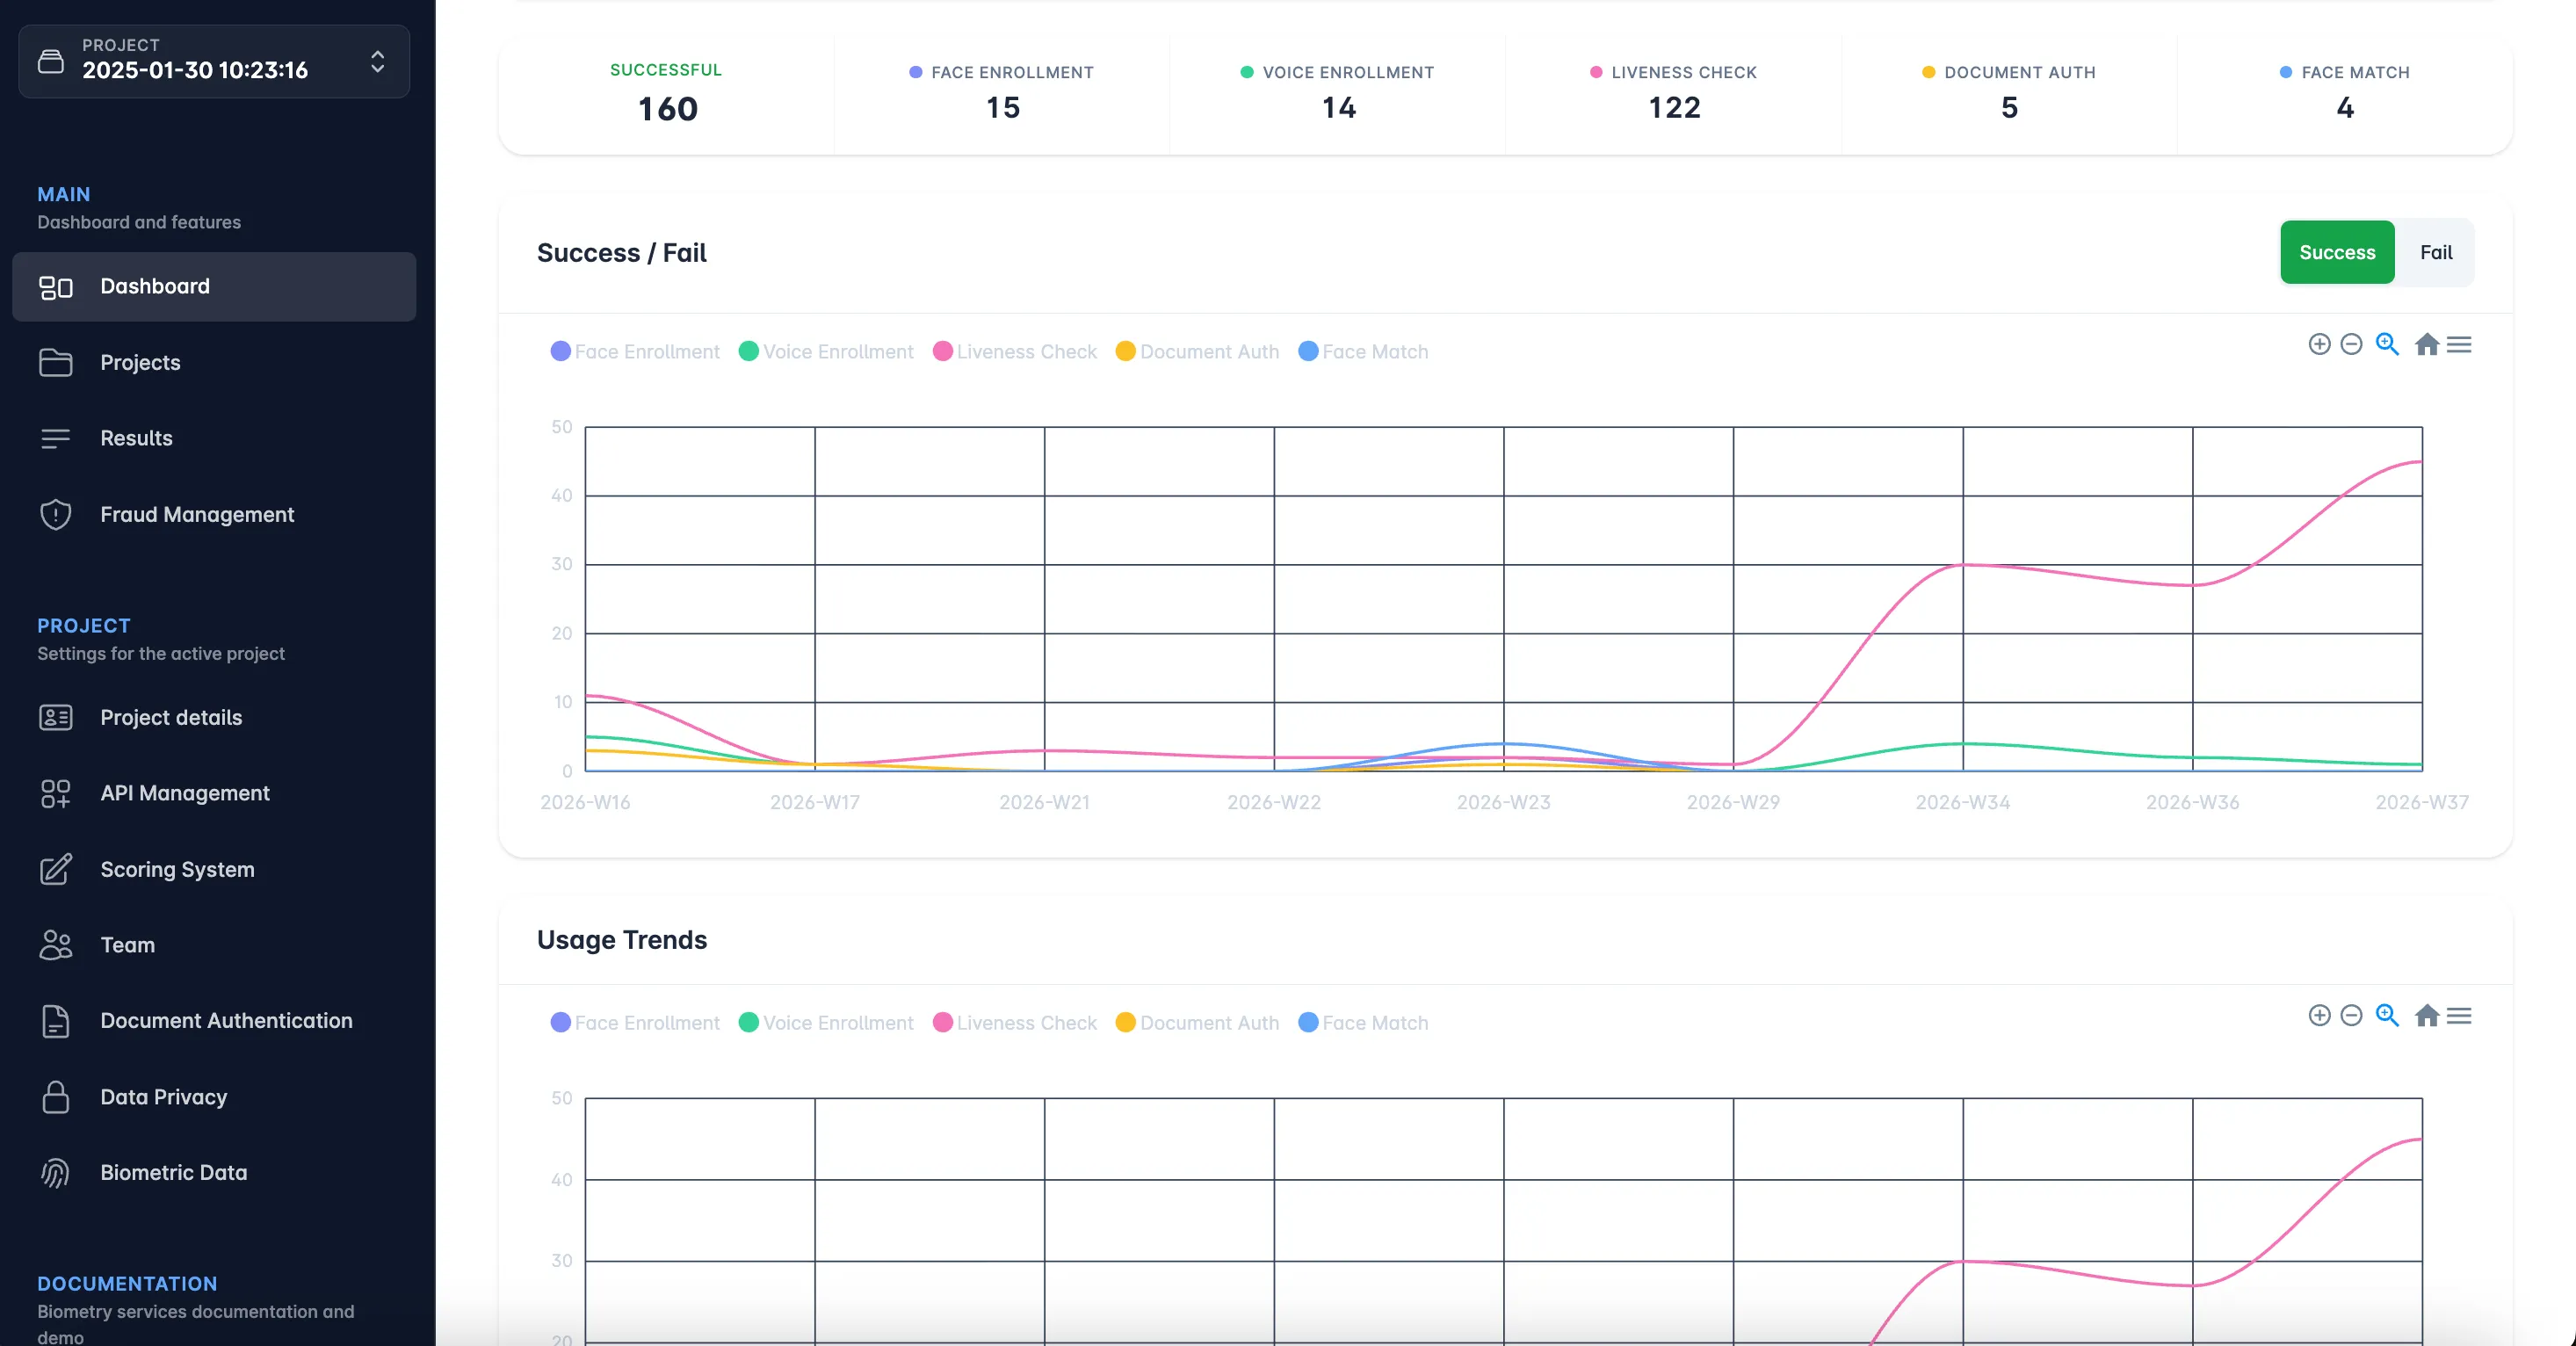
| Chart | What it tells you |
|---|---|
| Usage trends | Call volume over time — the first place a broken integration shows up |
| Success / Fail | The ratio, over the range you select |
| Avg duration | How long calls take. A rising line usually means capture length, not our latency |
| Breakdown by period | The same totals split across the range, for comparing days or weeks |
A falling success rate with steady volume points at capture quality or a threshold change. Falling volume points at your side.
Fraud events
Fraud rules watch for patterns a single verification cannot show: the same person appearing in two countries minutes apart, a device switching mid-session, repeated attempts against one identity.
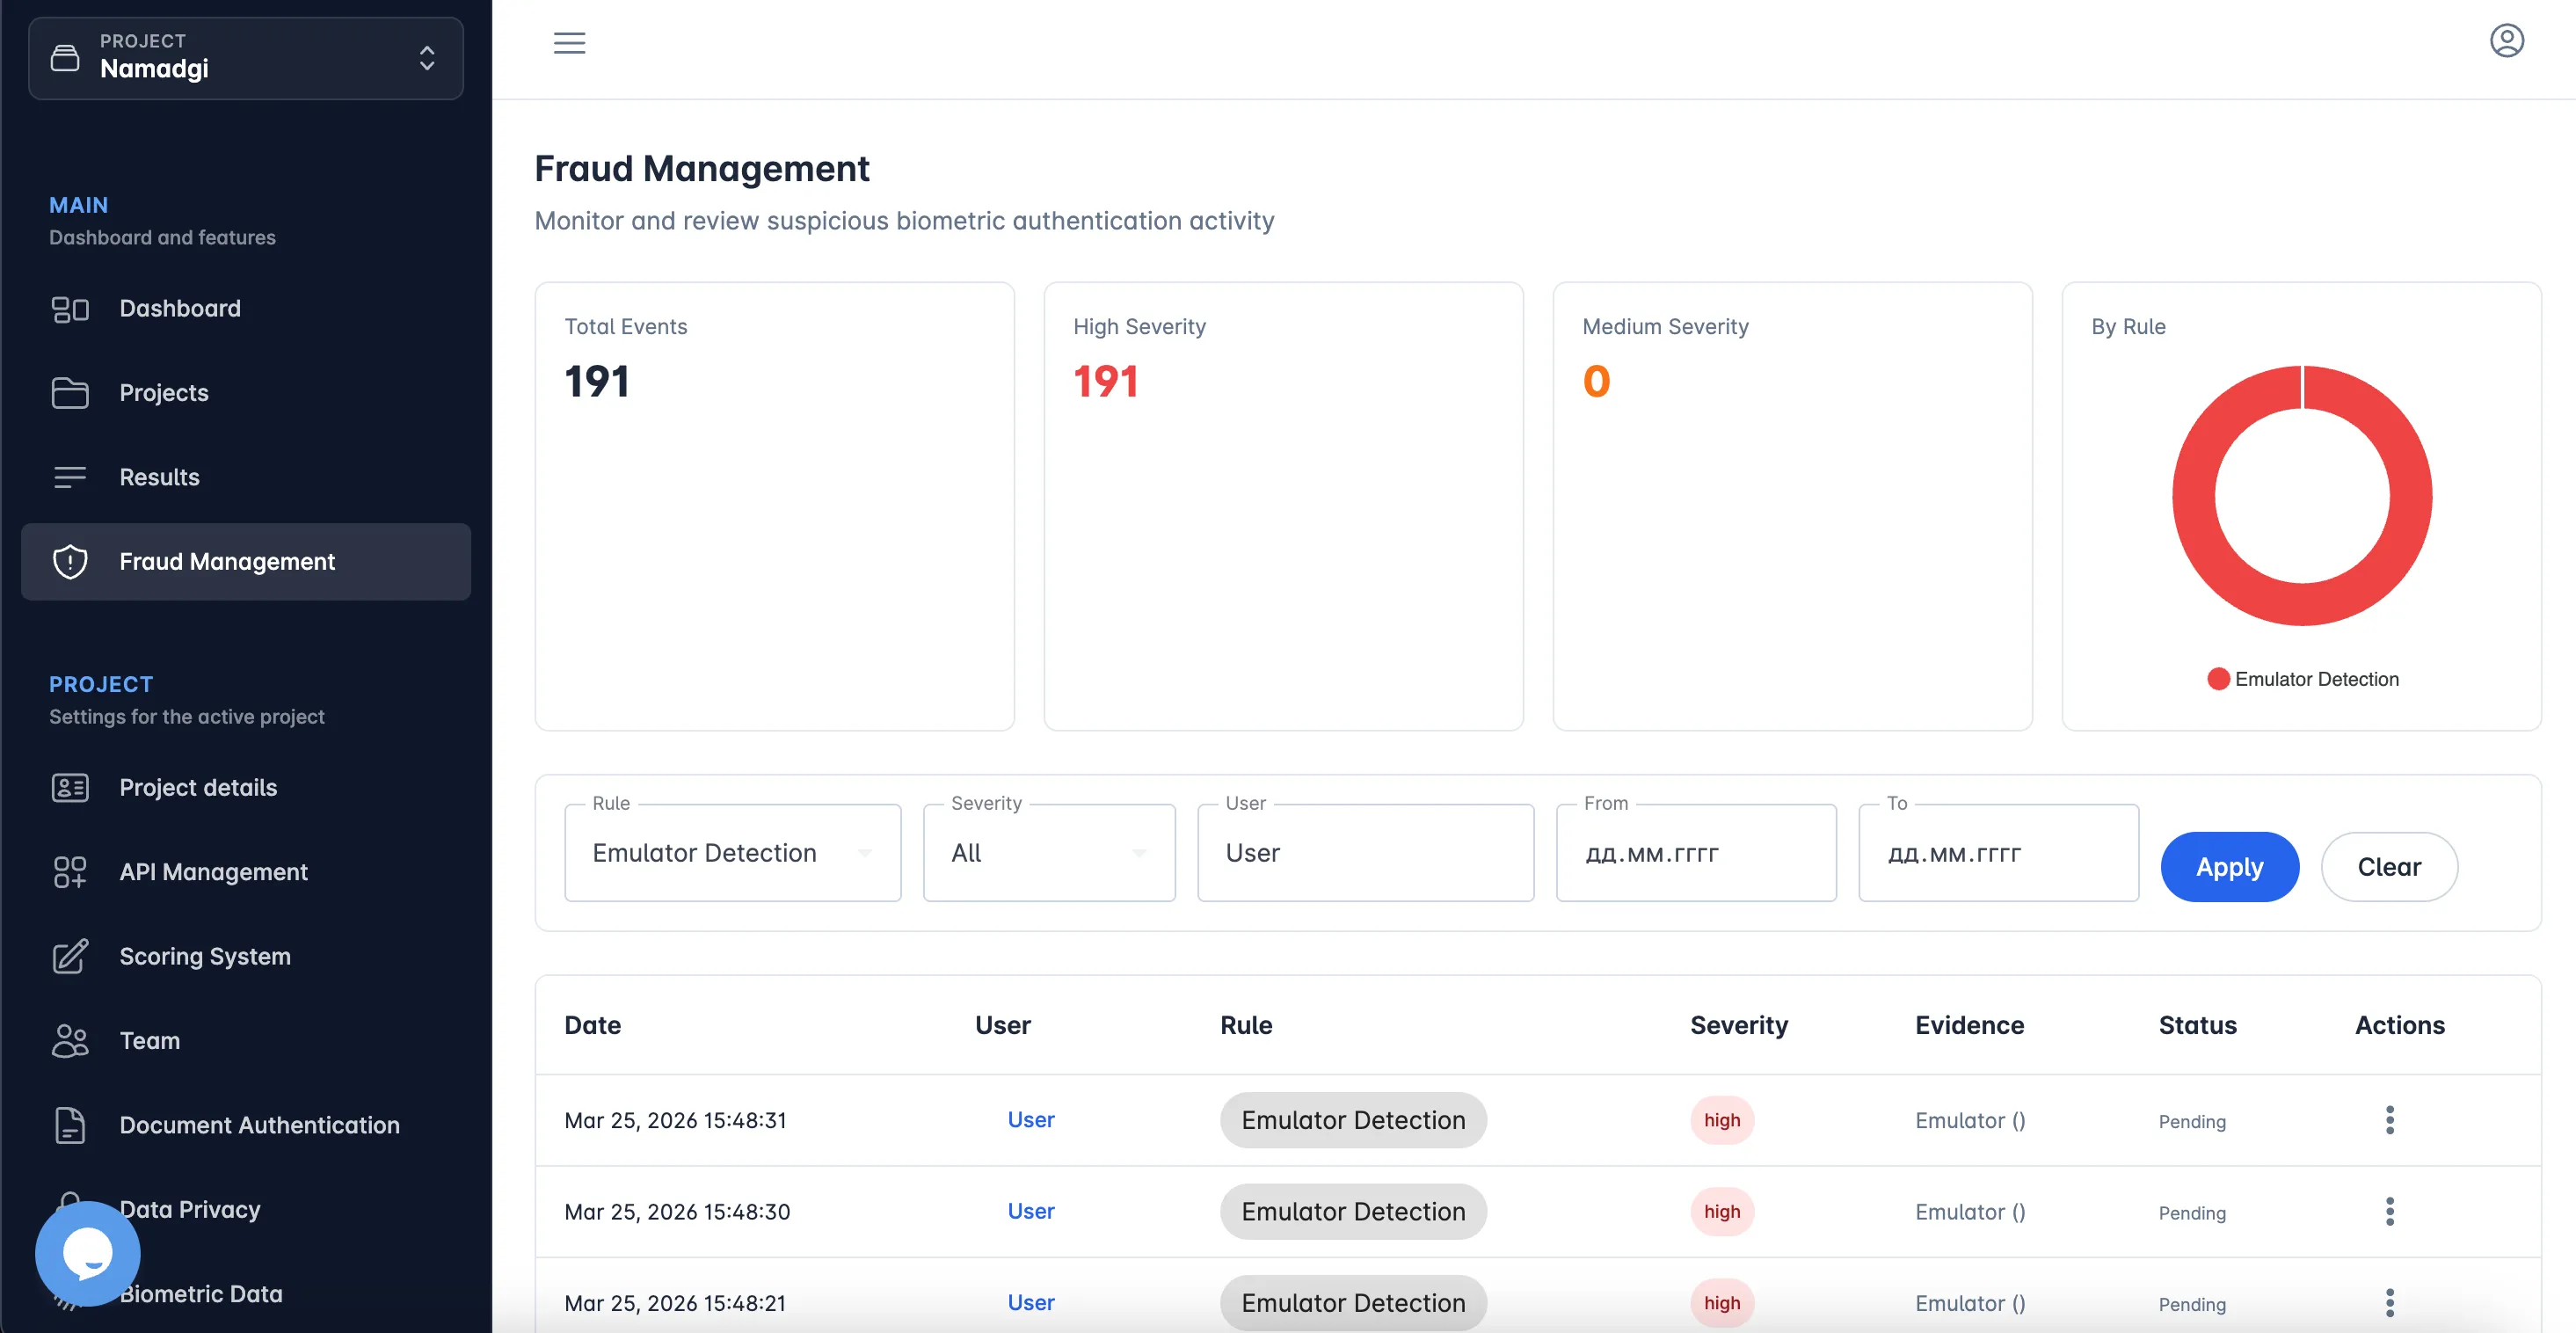
An event carries a severity and its evidence — the transactions and signals that triggered the rule. Each is resolved one of three ways:
| Action | Meaning |
|---|---|
| Confirm fraud | The signal was right |
| Dismiss | A false positive |
| Escalate | Needs someone with more context |
A fraud event is not a decision about a verification. A transaction can pass every biometric check and still raise an event, because the rule is judging the pattern around the attempt rather than the attempt itself. Resolving an event does not change any transaction’s decision — to do that, override the decision directly.